
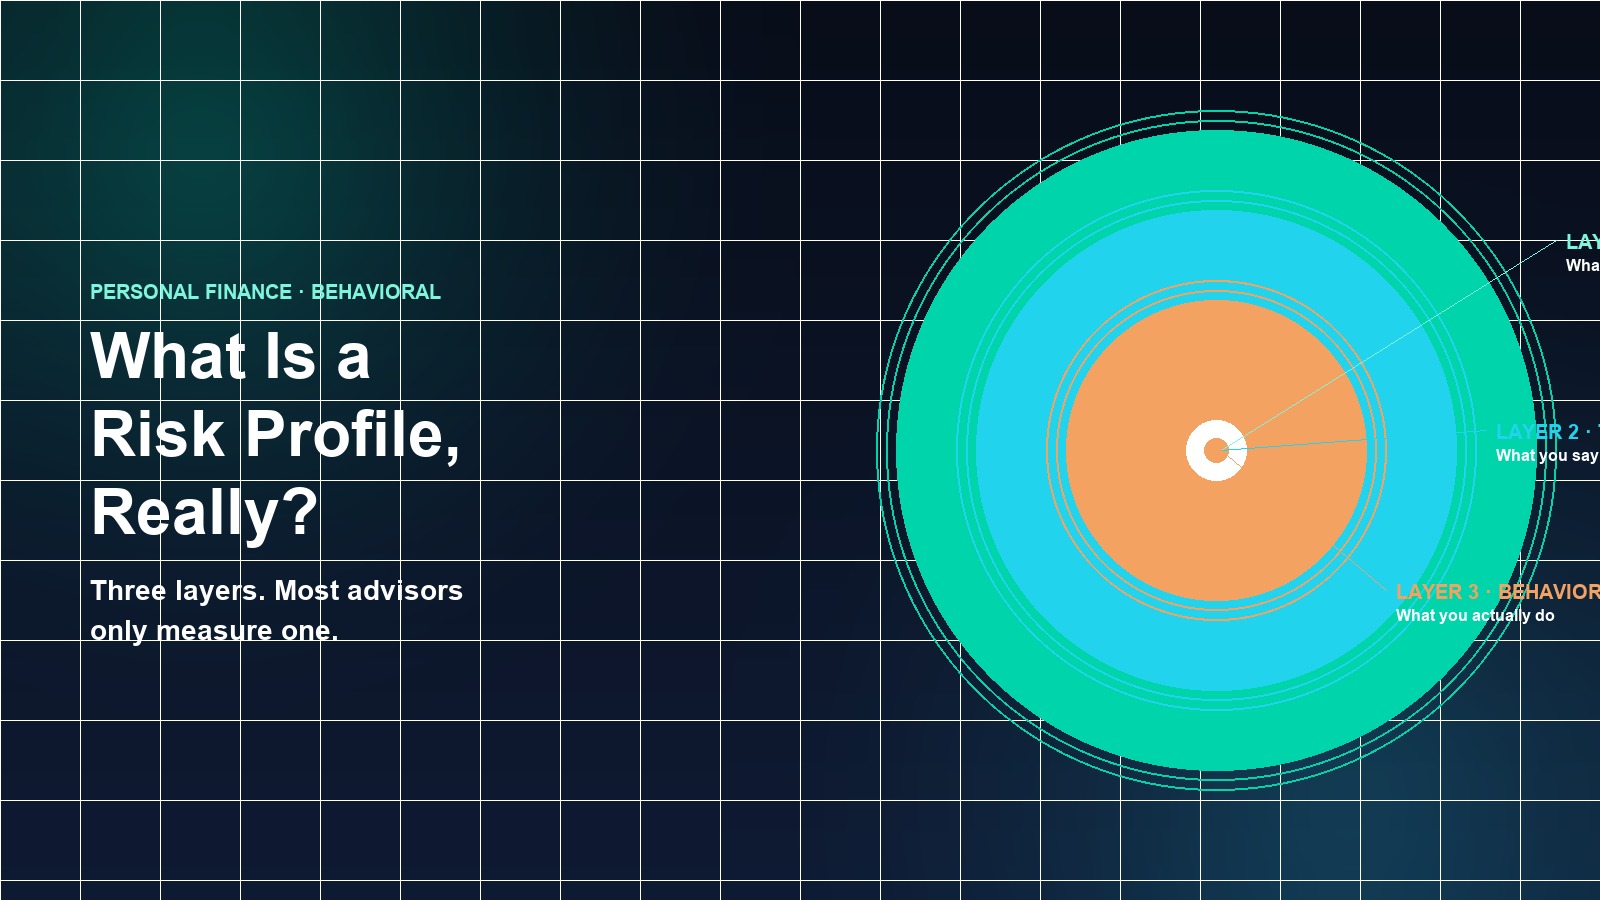

When you sit down with a financial advisor, one of the first things you'll encounter is a risk profile questionnaire. A series of questions designed to sort you into a category — conservative, moderate, aggressive — that then determines what you'll be recommended to invest in.
The questionnaire feels scientific. It has a scoring system. At the end, you get a number. But most people who've lived through a market correction know that the number rarely matches what they actually do when markets fall.
That disconnect is not a failure of the questionnaire. It is a failure to understand what a risk profile actually is. And more importantly, what determines how you'll actually behave when you need the answer most.
Layer 1: Risk Capacity
Risk capacity is the financial layer. It is determined entirely by your circumstances: your income, your assets, your liabilities, your time horizon, and your financial obligations.
If you are 28 years old, with stable employment, thirty years until retirement, and minimal debt, you have high risk capacity. You can afford to take losses — you have time to recover them and ongoing savings to deploy during downturns.
If you are 68 years old, recently retired, drawing income from your portfolio, and facing uncertain longevity, you have low risk capacity. Losses are not recoverable through future earnings, and you cannot afford extended drawdowns.
This layer is straightforward, objective, and relatively stable. Risk capacity is determined by math. Everyone should be clear on it.
Layer 2: Risk Tolerance
Risk tolerance is the psychological layer. It is your answer to the question: given your capacity, how much volatility can you psychologically handle?
This is what traditional questionnaires measure. The answer — whether you'd panic, whether you'd hold steady, whether you'd buy more — gets encoded into a risk tolerance score.
Importantly, risk tolerance is not the same as risk capacity. You might have high capacity (time, income, assets) but low tolerance (you hate seeing losses). You might have low capacity (near retirement) but high tolerance (you remain calm in volatility). The mismatch between the two is where problems emerge.
A classic advisory failure is recommending a portfolio that matches the client's stated tolerance but exceeds their actual capacity. When markets fall and the client suffers real losses, the tolerance evaporates.
Layer 3: Behavioral Risk Response
This is the layer that questionnaires almost never measure directly, even though it is the most predictive of actual behavior under stress.
Behavioral risk response is what you actually do when markets fall — not what you say you'll do, but what your actual history shows you do. A client might rate themselves as moderate risk tolerance, with adequate risk capacity. But their actual portfolio behavior shows they sold 40% of their equity positions the last time markets fell 12%. They didn't panic; they executed a consistent pattern. That pattern is their behavioral risk response.
Another client with the same stated tolerance and capacity might have added to equity positions during the same drawdown. Same tolerance score; opposite behavior. The gap between stated tolerance (Layer 2) and behavioral response (Layer 3) is where most of the surprises occur.
Why Questionnaires Capture Layer 2 (Poorly) and Miss Layer 3 Entirely
Hypothetical bias: questionnaires ask what you would do in a scenario that has not happened yet. Scenarios are abstract. Reality is visceral. Research consistently shows gaps between stated and revealed preference in financial decisions.
Social desirability: you want to present competently to your advisor. The format of the assessment and the context in which it's conducted shape the answer systematically. Clients tend to give more aggressive answers in face-to-face advisory meetings than in anonymous digital questionnaires.
Temporal instability: risk tolerance shifts. A questionnaire completed in the bull market of 2023 may not reflect your actual tolerance in volatile 2026.
But the more fundamental issue is that questionnaires don't capture Layer 3 at all. Behavioral risk response can only be measured by observing actual behavior. You cannot imagine it into being, and you cannot self-assess it accurately — the evidence shows that people are generally poor at predicting their own behavior under stress.
How Behavioral Risk Response Is Actually Revealed
How do you respond to drawdowns? Do you sell, hold, or add? How quickly? When does the impulse to act kick in?
What is your concentration pattern? Do you hold diversified portfolios, or do you tend to concentrate in a few positions? How does that pattern shift when one of your concentrated positions falls sharply?
How does your engagement intensity change with volatility? When markets are calm, do you check your portfolio daily or rarely? When volatility spikes, does your checking frequency increase dramatically? That shift in engagement is a behavioral signal.
What triggers your exits? Most investors have a set of exit patterns. The actual pattern, repeated over multiple positions, reveals something about your behavioral risk response that no questionnaire could capture. These are not good or bad patterns. They are your patterns. And they predict much better than any questionnaire how you'll actually behave when markets test you.
The Mismatch That Matters
Most investors encounter a moment when their actual behavior diverges from their stated tolerance, and they're surprised by it. They say, "I thought I could handle this," or "I didn't realize I'd panic this much."
That moment of surprise is real and useful. It's the point at which your stated tolerance and behavioral response have diverged enough that the gap is undeniable.
The goal is not to wait for that moment. The goal is to understand all three layers — capacity, tolerance, and behavioral response — before the next drawdown, so your portfolio is actually designed for how you'll behave, not how you hope you'll behave.
FinanSee App
Discover Your Real Risk Profile
FinanSee's Bias Lab combines behavioral scenarios with the checks, journal entries, and portfolio snapshots you choose to record. Together with capacity and tolerance assessment, it helps you build a richer picture of how you may respond under stress without claiming to predict every future decision. Free on iOS and Android.
Download FinanSee AppFinanSee is free on iOS and Android. Premium is available through monthly and annual native store subscriptions and includes full Bias Lab access with behavioral risk response analysis, unlimited Valora queries, decision journal, and personalised portfolio-fit analysis. The current localized price is shown before purchase; there is no automatic trial.